
By Asia Imtiaz
Table of Contents
2. Youth Unemployment in Pakistan. 2
3. Youth Unemployment in Punjab. 3
4. Youth Unemployment in Sindh. 5
5. Youth Unemployment in Khyber Pakhtunkhwa. 6
6. Youth Unemployment in Balochistan. 8
List of Tables
Table 1: No. of unemployed youth aged 15-24 years in Pakistan (million) 2
Table 2: Youth (15-24 years) unemployment rate in Pakistan (%) 2
Table 3: No. of unemployed youth aged 15-24 years in Punjab (million) 3
Table 4: Youth (15-24 years) unemployment rate in Punjab (%) 4
Table 5: No. of unemployed youth aged 15-24 years in Sindh (millions) 5
Table 6: Youth (15-24 years) unemployment rate in Sindh (%) 5
Table 7: No. of unemployed youth aged 15-24 years in KP (millions) 6
Table 8: Youth (15-24 years) unemployment rate in KP (%) 7
Table 9: No. of unemployed youth aged 15-24 years in Balochistan (millions) 8
Table 10: Youth (15-24 years) unemployment rate in Balochistan (%) 8
List of Figures
Figure 1: Youth (15-24 years) Unemployment Rate in Pakistan, 2001-2021. 3
Figure 2: Youth (15-24 years) unemployment rate in Punjab (%), 2001-21. 4
Figure 3: Youth (15-24 years) unemployment rate in Sindh (%), 2001-21. 6
Figure 4: Youth (15-24 years) unemployment rate in KP (%), 2001-21. 8
Figure 5: Youth (15-24 years) unemployment rate in Balochistan (%), 2001-21. 9
1. Introduction
Pakistan is currently undergoing a demographic transition due to which the share of youth in the country’s population is rising relative to the adult population. The youth aged 15-24 years, making up a significant percentage of the country’s population, is also an important segment of the labour market who are entering the workforce in large numbers after completing higher education. The youth labour market entrants are generally considered as the most productive and innovative elements of any country’s labour market. Therefore, monitoring labour market outcomes with respect to this population group (15-24 years) takes on an increasing significance.
Globally, the youth unemployment rate is the most widely used measure of labour market performance of young people, with a higher rate of youth unemployment in comparison to the open unemployment rate indicating narrower opportunities for these new entrants to the labour force.
The national aggregates figures for youth unemployment rate, while providing a snapshot of the youth labour market outcomes in a country, need to be supplemented by more disaggregated information so as to properly capture disparities within regions, provinces, and gender, to provide a more complete picture of the youth labour market situation within a country. This disaggregated data would enable policymakers to easily pinpoint the decent work deficits that require greater attention and devise appropriate remedial interventions.
The Statistical Report of Youth Unemployment Rate for Pakistan compiled by Policy Research Innovation Development and Education (PRIDE) attempts to fill these data gaps by presenting a time series analysis of youth unemployment rate over the last two decades, i.e., during the period 2001-21.
This analysis has been carried out using data from multiple rounds of the Labour Force Survey (LFS) conducted by the Pakistan Bureau of Statistics (PBS) over this period. For the years that no round of LFS was available, the values of youth unemployment rate have been interpolated to develop a consistent time series during the period under review[1]. The time series of youth unemployment rate has been constructed for age brackets 15-24 years. It is pertinent to point out that the age bracket of 15-24 years corresponds to the definition of youth employed at the global level. Overall, the report by bringing together time series data of youth unemployment rates during 2001-21 by gender, region and province, will provide a much-needed time series database to the government, international organizations and researchers for analysis, policy formulation and development of programmatic interventions
Note: [1] During this 20-year period, the LFS was not conducted in 6 years i.e., 2002-03, 2011-12, 2015-16, 2016-17 and 2019-20.
2. Youth Unemployment in Pakistan
Table 1: No. of unemployed youth aged 15-24 years in Pakistan (million)
Source: Pakistan Bureau of Statistics (PBS), Labour Force Survey, various issues
Table 2: Youth (15-24 years) unemployment rate in Pakistan (%)
| Years | Overall | Female | Male | Gap (Male & Female) | Rural | Urban | Gap (Rural & Urban) |
| 2001-02 | 13.41 | 20.5 | 12.02 | -8.48 | 12.1 | 16.05 | -3.95 |
| 2002-03 | 12.55 | 17.71 | 11.5 | -6.21 | 11.09 | 15.53 | -4.44 |
| 2003-04 | 11.69 | 14.91 | 10.97 | -3.94 | 10.08 | 15 | -4.92 |
| 2004-05 | 10.17 | 12.27 | 9.69 | -2.58 | 8.63 | 13.38 | -4.75 |
| 2005-06 | 8.64 | 9.62 | 8.4 | -1.22 | 7.17 | 11.75 | -4.58 |
| 2006-07 | 7.48 | 8.90 | 7.11 | -1.79 | 6.06 | 10.5 | -4.44 |
| 2007-08 | 7.73 | 10.5 | 6.98 | -3.52 | 6.51 | 10.59 | -4.08 |
| 2008-09 | 8.33 | 11.43 | 7.43 | -4 | 6.91 | 11.5 | -4.59 |
| 2009-10 | 8.39 | 11.5 | 7.48 | -4.02 | 6.62 | 12.42 | -5.8 |
| 2010-11 | 10.27 | 13.32 | 9.3 | -4.02 | 7.82 | 15.79 | -7.97 |
| 2011-12 | 10.41 | 12.94 | 9.61 | -3.33 | 8.23 | 15.34 | -7.11 |
| 2012-13 | 10.54 | 12.56 | 9.92 | -2.64 | 8.64 | 14.89 | -6.25 |
| 2013-14 | 10.35 | 12.96 | 9.45 | -3.51 | 8.43 | 14.72 | -6.29 |
| 2014-15 | 10.61 | 13.73 | 9.54 | -4.19 | 8.9 | 14.69 | -5.79 |
| 2015-16 | 10.77 | 13.00 | 10.01 | -2.99 | 9.08 | 14.63 | -5.55 |
| 2016-17 | 10.93 | 12.27 | 10.48 | -1.79 | 9.26 | 14.57 | -5.31 |
| 2017-18 | 11.09 | 11.53 | 10.95 | -0.58 | 9.45 | 14.50 | -5.05 |
| 2018-19 | 12.47 | 16.22 | 11.16 | -5.06 | 11.00 | 15.89 | -4.89 |
| 2019-20 | 11.79 | 15.32 | 10.59 | -4.73 | 10.48 | 14.89 | -4.41 |
| 2020-21 | 11.1 | 14.42 | 10.02 | -4.4 | 9.95 | 13.88 | -3.93 |
| Range 2020-21 to 2001-02 | -2.31 | -6.08 | -2 | -2.15 | -2.17 |
Source: Pakistan Bureau of Statistics (PBS), Labour Force Survey, various issues
Note: The underlined figures show interpolated values
*Difference/range form highest to lowest year (2020-21 to 2001-02)
Figure 1: Youth (15-24 years) Unemployment Rate in Pakistan, 2001-2021
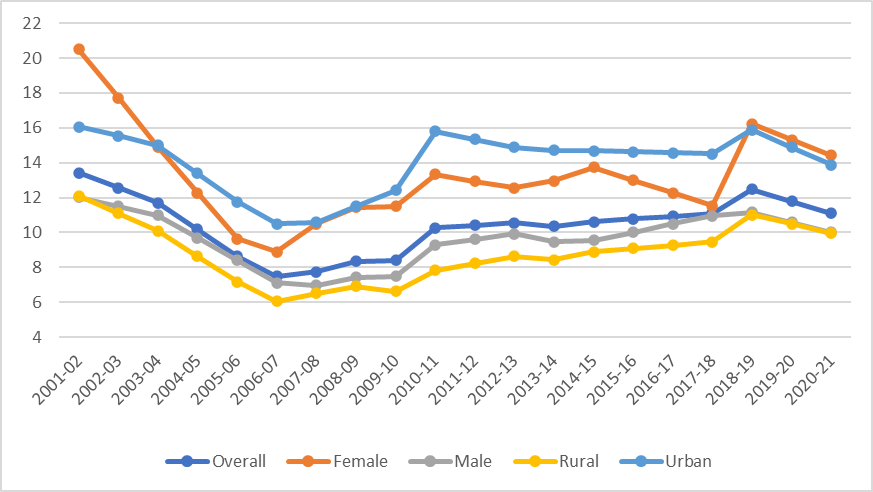
Source: Pakistan Bureau of Statistics (PBS), Labour Force Survey, various issues
3. Youth Unemployment in Punjab
a) Youth aged 15-24 years
Table 3: No. of unemployed youth aged 15-24 years in Punjab (million)
| 2001-02 | 2020-21 | |
| Overall | 1.05 | 1.27 |
| Female | 0.32 | 0.42 |
| Male | 0.74 | 0.85 |
| Rural | 0.63 | 0.83 |
| Urban | 0.42 | 0.44 |
Source: Pakistan Bureau of Statistics (PBS), Labour Force Survey, various issues
Note: From the year 2017-18, PBS started to give separate data for Islamabad and exclude it from Punjab. For the purpose of consistency, we include Islamabad in Punjab from the year 2017-18 to 2020-21.
Table 4: Youth (15-24 years) unemployment rate in Punjab (%)
| Years | Overall | Female | Male | Gap (Male & Female) | Rural | Urban | Gap (Rural & Urban) |
| 2001-02 | 13.45 | 19.21 | 11.91 | -7.3 | 11.8 | 16.96 | -5.16 |
| 2002-03 | 2.2 | 15.19 | 11.39 | -3.8 | 10.53 | 15.88 | -5.35 |
| 2003-04 | 10.94 | 11.17 | 10.87 | -0.3 | 9.26 | 14.79 | -5.53 |
| 2004-05 | 9.72 | 8.96 | 9.99 | 1.03 | 7.90 | 13.88 | -5.98 |
| 2005-06 | 8.51 | 6.76 | 9.11 | 2.35 | 6.54 | 12.97 | -6.43 |
| 2006-07 | 7.73 | 7.40 | 7.85 | 0.45 | 5.94 | 11.96 | -6.02 |
| 2007-08 | 8.26 | 9.52 | 7.83 | -1.69 | 6.63 | 12.28 | -5.65 |
| 2008-09 | 8.98 | 9.9 | 8.65 | -1.25 | 7.39 | 12.69 | -5.3 |
| 2009-10 | 8.76 | 9.65 | 8.43 | -1.22 | 6.74 | 13.61 | -6.87 |
| 2010-11 | 9.99 | 11.72 | 9.28 | -2.44 | 7.96 | 14.93 | -6.97 |
| 2011-12 | 10.6 | 11.74 | 10.13 | -1.61 | 8.74 | 15.19 | -6.45 |
| 2012-13 | 11.21 | 11.77 | 10.99 | -0.78 | 9.52 | 15.45 | -5.93 |
| 2013-14 | 11.1 | 11.65 | 10.86 | -0.79 | 9.02 | 16.28 | -7.26 |
| 2014-15 | 11.61 | 11.69 | 11.58 | -0.11 | 9.61 | 16.89 | -7.28 |
| 2015-16 | 11.61 | 11.21 | 11.77 | 0.56 | 9.87 | 16.02 | -6.15 |
| 2016-17 | 11.61 | 10.73 | 11.96 | 1.23 | 10.13 | 15.15 | -5.02 |
| 2017-18 | 11.60 | 10.26 | 12.16 | 1.9 | 10.38 | 14.28 | -3.9 |
| 2018-19 | 13.64 | 15.64 | 12.78 | -2.86 | 12.08 | 17.44 | -5.36 |
| 2019-20 | 12.8 | 14.69 | 12.01 | -2.68 | 11.53 | 15.90 | -4.37 |
| 2020-21 | 11.95 | 13.73 | 11.23 | -2.5 | 10.97 | 14.36 | -3.39 |
| Range | -1.5 | -5.48 | -0.68 | -0.83 | -2.6 |
Source: Pakistan Bureau of Statistics (PBS), Labour Force Survey, various issues
Note: The underlined figures show interpolated values
*Difference/range form highest to lowest year (2020-21 to 2001-02)
Figure 2: Youth (15-24 years) unemployment rate in Punjab (%), 2001-21
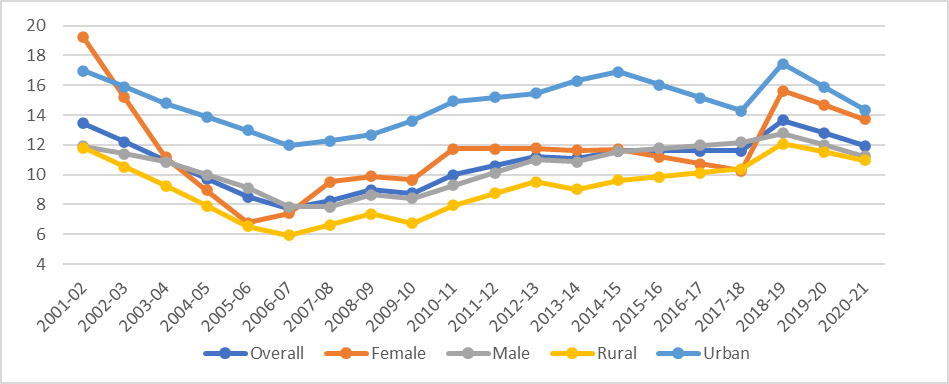
Source: Pakistan Bureau of Statistics (PBS), Labour Force Survey, various issues
4. Youth Unemployment in Sindh
a) Youth aged 15-24 years
Table 5: No. of unemployed youth aged 15-24 years in Sindh (millions)
| 2001-02 | 2020-21 | |
| Overall | 0.21 | 0.28 |
| Female | 0.04 | 0.06 |
| Male | 0.18 | 0.22 |
| Rural | 0.05 | 0.08 |
| Urban | 0.16 | 0.20 |
Source: Pakistan Bureau of Statistics (PBS), Labour Force Survey, various issues
Table 6: Youth (15-24 years) unemployment rate in Sindh (%)
| Years | Overall | Female | Male | Gap (Male & Female) | Rural | Urban | Gap (Rural & Urban) |
| 2001-02 | 8.34 | 18.22 | 7.51 | -10.71 | 4.04 | 12.61 | -8.57 |
| 2002-03 | 9.16 | 22 | 7.94 | -14.06 | 5.37 | 12.97 | -7.6 |
| 2003-04 | 9.98 | 25.77 | 8.37 | -17.4 | 6.7 | 13.32 | -6.62 |
| 2004-05 | 8.25 | 18.37 | 7.24 | -11.13 | 5.53 | 11.15 | -5.62 |
| 2005-06 | 6.52 | 10.97 | 6.1 | -4.87 | 4.36 | 8.97 | -4.61 |
| 2006-07 | 4.98 | 9.33 | 4.54 | -4.79 | 2.72 | 7.55 | -4.83 |
| 2007-08 | 4.38 | 6.28 | 4.07 | -2.21 | 2.41 | 7.2 | -4.79 |
| 2008-09 | 4.96 | 10.72 | 3.91 | -6.81 | 2.25 | 8.62 | -6.37 |
| 2009-10 | 6.11 | 12.44 | 5.04 | -7.4 | 3.06 | 10.39 | -7.33 |
| 2010-11 | 9.5 | 11.76 | 9.07 | -2.69 | 3.64 | 17.43 | -13.79 |
| 2011-12 | 8.55 | 10.22 | 8.24 | -1.98 | 3.49 | 15.47 | -11.98 |
| 2012-13 | 7.6 | 8.68 | 7.41 | -1.27 | 3.33 | 13.51 | -10.18 |
| 2013-14 | 6.95 | 10.49 | 6.3 | -4.19 | 3.73 | 11.34 | -7.61 |
| 2014-15 | 7.21 | 16.15 | 5.59 | -10.56 | 4.21 | 11.43 | -7.22 |
| 2015-16 | 8.27 | 15.68 | 7.00 | -8.68 | 4.96 | 12.64 | -7.68 |
| 2016-17 | 9.33 | 15.21 | 8.41 | -6.8 | 5.71 | 13.85 | -8.14 |
| 2017-18 | 10.40 | 14.73 | 9.81 | -4.92 | 6.46 | 15.07 | -8.61 |
| 2018-19 | 7.83 | 9.87 | 7.41 | -2.46 | 3.75 | 13.00 | -9.25 |
| 2019-20 | 7.42 | 9.41 | 7 | -2.41 | 3.53 | 12.63 | -9.1 |
| 2020-21 | 7 | 8.94 | 6.59 | -2.35 | 3.31 | 12.26 | -8.95 |
| Range | -1.34 | -9.28 | -0.92 | -0.73 | -0.35 |
Source: Pakistan Bureau of Statistics (PBS), Labour Force Survey, various issues
Note: The underlined figures show interpolated values
Figure 3: Youth (15-24 years) unemployment rate in Sindh (%), 2001-21
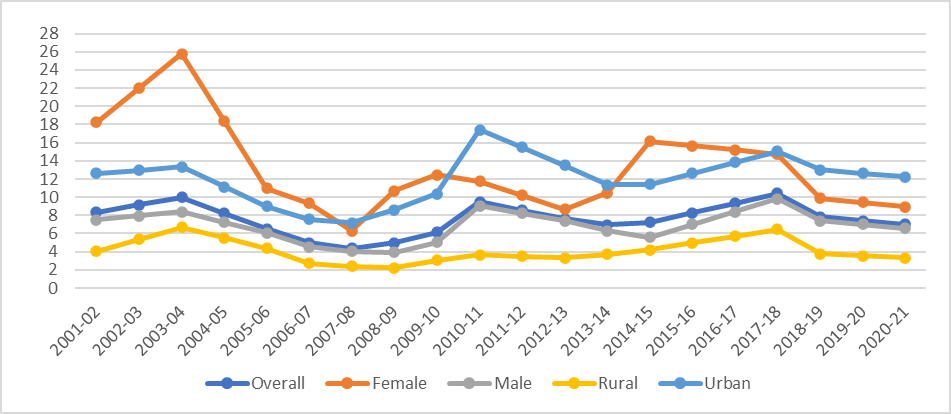
Source: Pakistan Bureau of Statistics (PBS), Labour Force Survey, various issues
5. Youth Unemployment in Khyber Pakhtunkhwa
a) Youth aged 15-24 years
Table 7: No. of unemployed youth aged 15-24 years in KP (millions)
| KP | 2001-02 | 2020-21 |
| Overall | 0.29 | 0.38 |
| Female | 0.04 | 0.15 |
| Male | 0.25 | 0.23 |
| Rural | 0.24 | 0.33 |
| Urban | 0.05 | 0.06 |
Source: Pakistan Bureau of Statistics (PBS), Labour Force Survey, various issues
Table 8: Youth (15-24 years) unemployment rate in KP (%)
| Years | Overall | Female | Male | Gap (Male & Female) | Rural | Urban | Gap (Rural & Urban) |
| 2001-02 | 20.85 | 33.5 | 19.51 | -13.99 | 20.82 | 21.02 | -0.2 |
| 2002-03 | 19.14 | 32.03 | 17.53 | -14.5 | 18.67 | 21.57 | -2.9 |
| 2003-04 | 17.42 | 30.55 | 15.54 | -15.01 | 16.51 | 22.12 | -5.61 |
| 2004-05 | 15.98 | 30.97 | 13.37 | -17.6 | 15.39 | 19.07 | -3.68 |
| 2005-06 | 14.53 | 31.39 | 11.2 | -20.19 | 14.27 | 16.01 | -1.74 |
| 2006-07 | 12.45 | 23.29 | 10.8 | -12.49 | 12.13 | 13.98 | -1.85 |
| 2007-08 | 12.76 | 21.76 | 10.51 | -11.25 | 12.66 | 13.22 | -0.56 |
| 2008-09 | 13.63 | 20.89 | 11.6 | -9.29 | 12.75 | 18.33 | -5.58 |
| 2009-10 | 12.71 | 23.05 | 9.99 | -13.06 | 12.33 | 14.76 | -2.43 |
| 2010-11 | 14.2 | 27.66 | 10.68 | -16.98 | 13.87 | 15.95 | -2.08 |
| 2011-12 | 14.44 | 27.39 | 11.16 | -16.23 | 13.93 | 16.96 | -3.03 |
| 2012-13 | 14.67 | 27.11 | 11.64 | -15.47 | 13.98 | 17.97 | -3.99 |
| 2013-14 | 13.22 | 28.46 | 9.1 | -19.36 | 12.2 | 17.86 | -5.66 |
| 2014-15 | 13.42 | 30.09 | 9.69 | -20.4 | 13.1 | 14.82 | -1.72 |
| 2015-16 | 12.31 | 24.49 | 9.61 | -14.88 | 11.93 | 14.1 | -2.17 |
| 2016-17 | 11.2 | 18.89 | 9.53 | -9.36 | 10.76 | 13.38 | -2.62 |
| 2017-18 | 10.09 | 13.29 | 9.45 | -3.84 | 9.6 | 12.65 | -3.05 |
| 2018-19 | 14.99 | 26.79 | 11.26 | -15.53 | 15.18 | 13.85 | 1.33 |
| 2019-20 | 14.61 | 25.72 | 11.18 | -14.54 | 14.68 | 14.18 | 0.5 |
| 2020-21 | 14.22 | 24.65 | 11.09 | -13.56 | 14.17 | 14.51 | -0.34 |
| Range | -6.63 | -8.85 | -8.42 | -6.65 | -6.51 |
Source: Pakistan Bureau of Statistics (PBS), Labour Force Survey, various issues
Note: The underlined figures show interpolated values
Figure 4: Youth (15-24 years) unemployment rate in KP (%), 2001-21
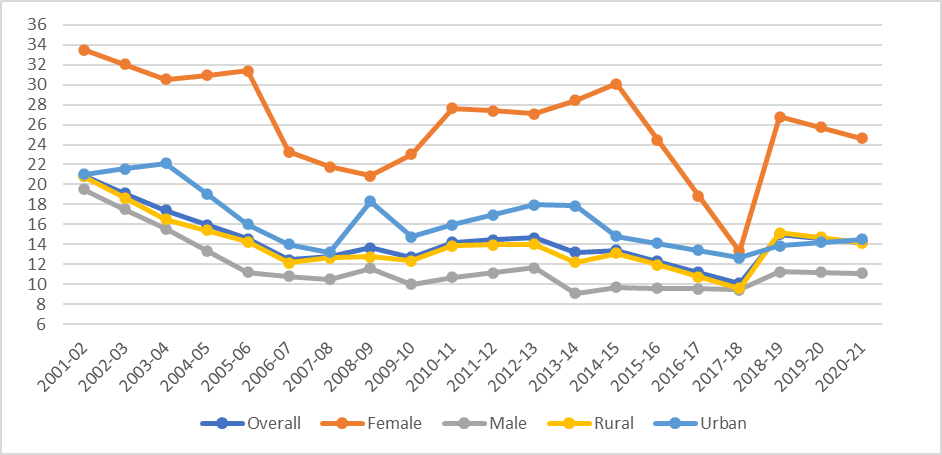
Source: Pakistan Bureau of Statistics (PBS), Labour Force Survey, various issues
6. Youth Unemployment in Balochistan
a) Youth aged 15-24 years
Table 9: No. of unemployed youth aged 15-24 years in Balochistan (millions)
| Balochistan | 2001-02 | 2020-21 |
| Overall | 0.08 | 0.09 |
| Female | 0.02 | 0.01 |
| Male | 0.07 | 0.08 |
| Rural | 0.06 | 0.05 |
| Urban | 0.02 | 0.04 |
Source: Pakistan Bureau of Statistics (PBS), Labour Force Survey, various issues
Table 10: Youth (15-24 years) unemployment rate in Balochistan (%)
| Years | Overall | Female | Male | Gap (Male & Female) | Rural | Urban | Gap (Rural & Urban) |
| 2001-02 | 18.16 | 42.92 | 16.01 | -26.91 | 16 | 28.11 | -12.11 |
| 2002-03 | 17.42 | 37.55 | 15.34 | -22.21 | 14.91 | 27.49 | -12.58 |
| 2003-04 | 16.67 | 32.17 | 14.67 | -17.5 | 13.82 | 26.86 | -13.04 |
| 2004-05 | 11.24 | 19.94 | 10.14 | -9.8 | 8.99 | 19.81 | -10.82 |
| 2005-06 | 5.81 | 7.7 | 5.61 | -2.09 | 4.15 | 12.75 | -8.6 |
| 2006-07 | 4.35 | 13.95 | 2.88 | -11.07 | 3.27 | 8.72 | -5.45 |
| 2007-08 | 4.65 | 16.45 | 3.36 | -13.09 | 3.7 | 8.48 | -4.78 |
| 2008-09 | 3.29 | 14.36 | 2.03 | -12.33 | 2.54 | 6.33 | -3.79 |
| 2009-10 | 3.98 | 9.11 | 3.38 | -5.73 | 3.54 | 5.79 | -2.25 |
| 2010-11 | 7.58 | 13.33 | 7.01 | -6.32 | 6.03 | 12.77 | -6.74 |
| 2011-12 | 7.54 | 9.78 | 7.34 | -2.44 | 5.96 | 13.21 | -7.25 |
| 2012-13 | 7.5 | 6.22 | 7.67 | 1.45 | 5.89 | 13.65 | -7.76 |
| 2013-14 | 10.42 | 10.9 | 10.35 | -0.55 | 9.47 | 13.61 | -4.14 |
| 2014-15 | 7.88 | 11.11 | 6.91 | -4.2 | 7.63 | 8.83 | -1.2 |
| 2015-16 | 8.76 | 19.07 | 7.16 | -11.91 | 8.02 | 11.39 | -3.37 |
| 2016-17 | 9.64 | 27.03 | 7.41 | -19.62 | 8.41 | 13.95 | -5.54 |
| 2017-18 | 10.51 | 35 | 7.65 | -27.35 | 8.8 | 16.51 | -7.71 |
| 2018-19 | 11.1 | 14.5 | 10.5 | -4 | 8.46 | 19.93 | -11.47 |
| 2019-20 | 10.51 | 12.51 | 10.16 | -2.35 | 7.86 | 18.99 | -11.13 |
| 2020-21 | 9.91 | 10.52 | 9.82 | -0.7 | 7.25 | 18.05 | -10.8 |
Source: Pakistan Bureau of Statistics (PBS), Labour Force Survey, various issues
Note: The underlined figures show interpolated values
Figure 5: Youth (15-24 years) unemployment rate in Balochistan (%), 2001-21
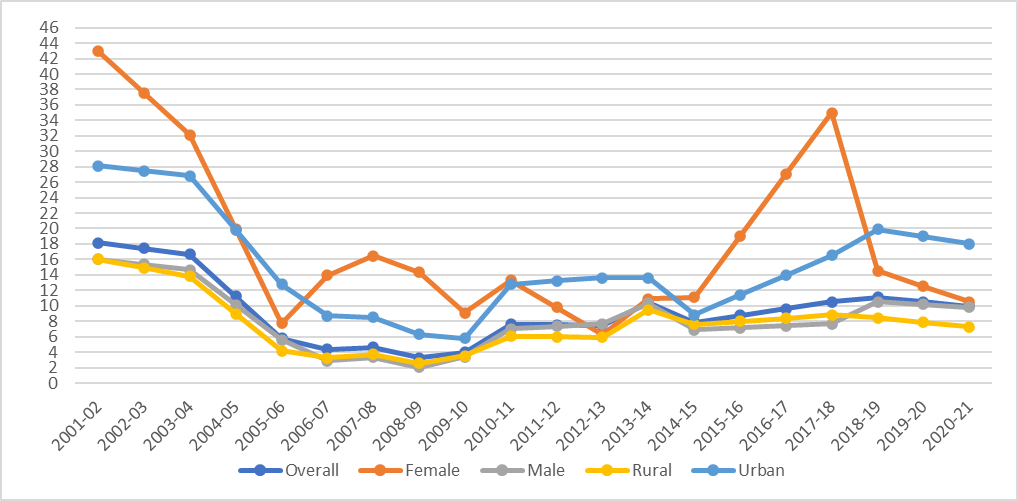
Source: Pakistan Bureau of Statistics (PBS), Labour Force Survey, various issues
[1] During this 20-year period, the LFS was not conducted in 6 years i.e., 2002-03, 2011-12, 2015-16, 2016-17 and 2019-20.