
Author: Dr. Shahid Naeem
(Islamabad) Research conducted by PRIDE, using data from the Labour Force Survey 2020-21 shows that 30.5 million workers in Pakistan are employed in non-agricultural informal sector in comparison to 11.6 million in the non-agriculture formal sector.
Dr. Shahid Naeem, Director PRIDE informs that the current series of Reports would be looking at various aspects of informal sector workers using the microdata of Pakistan Labour Force Survey 2020-21, which is a large-scale survey covering close to 100,000 households, conducted by the Pakistan Bureau of Statistics (PBS). The objective is to inform policy and offer viable solutions to address informality in Pakistan, which is one of the barriers to sustained growth.
KEY FINDINGS
Situation Analysis of Informal Sector Employment in Pakistan
A predominant segment of Pakistan’s labor force is employed in the informal sector. Workers in this sector frequently face issues such as low wages, absence of job stability, and limited access to formal social protection as well as other deficiencies in decent work conditions. Addressing informality is an important target of the 2030 Agenda for Sustainable Development. Decent work conditions, especially the formal employment, helps in achieving economic growth targets and reducing inequalities through social inclusion. The targets under SDG8 related to decent work and economic growth calls for reducing the proportion of informal employment in total employment in all sectors of the economy, both for men and women.
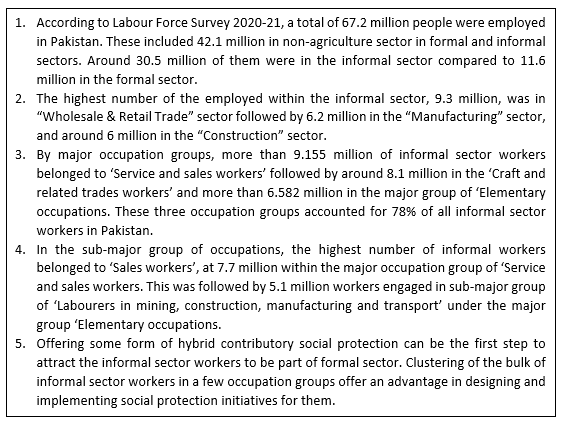
According to Labour Force Survey 2020-21, the total employment in the country was 67.2 million. The analysis of LFS 2020-21 data for the distribution of total employment by Industry/ Division, shows that the largest share of employment was in ‘Agriculture’ sector, at 37.5 percent (25.2 million), followed by those in ‘Community/ Social & Personal Services’ accounting for more than 16 percent of all employment (10.8 million). The ‘Manufacturing’ sector employed 14.9 percent of total employment (10 million) and ‘Wholesale & Retail Trade’ engaged around 14.4 percent of total employed (9.7 million). Around 9.5 percent (6.4 million) of the employed were engaged in the ‘Construction’ sector and the remaining 1 percent (1.5 million) were categorized as ‘others’ (including ‘Mining & Quarrying’; ‘Electricity, Gas & Water’; ‘Finance, Insurance, Real Estate & Business Services’; and ‘Extraterritorial Organization and Bodies’).
The total non-agriculture sector employment (42.1 million) is disaggregated into formal and informal sectors. The LFS 2020-21 data shows that major share of non-agricultural employment was in the informal sector, at 30.5 million (72.5 percent of all employed in non-agriculture sector) in comparison to 11.6 million (27.5 percent) in the formal sector.
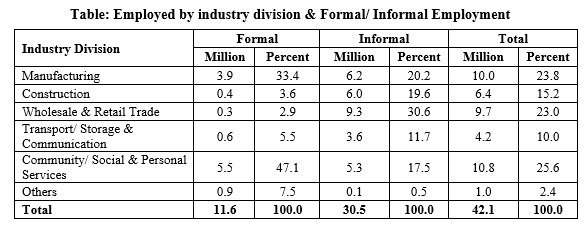
Within informal sector, the highest number of the employed was in “Wholesale & Retail Trade” sector, at 9.3 million, which accounted for 30.6 percent of total informal sector employment, followed by “Manufacturing” sector, 6.2 million (20.2 percent), and “Construction” sector, 6 million (19.6 percent). The above table shows the difference in the number of workers employed in the formal and informal sector by each of the industry division.
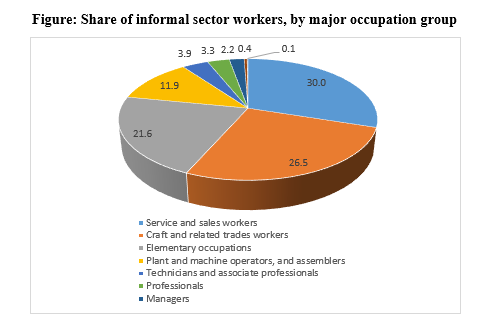
Another aspect of looking at the informality and its spread in the economy is the distribution of the informal sector workers across different occupations. According to the two-digit sub-group classification of occupations following the Pakistan Standard Classification of Occupations, 2015, the distribution of these 30.5 million informal workers is as under:
- The largest portion of the informal sector workers in Pakistan is engaged in the ‘Service and sales workers’ major group of occupations, where more than 9.155 million people were engaged accounting for 30% of all informal sector workers in the country. These included 7.714 million workers (84% of all ‘service and sales workers’) engaged in the ‘Sales workers’ sub-major group of occupations, and 1.326 million workers (14% of all ‘service and sales workers’) engaged in the ‘Personal service workers’ sub-major group;
- In the ‘Craft and related trades workers’ major group of occupations, 8.089 million people were engaged, which accounted for 26.5% of all informal sector workers. This included 3.749 million workers (46% of all ‘Craft and related trades workers’) engaged in the sub-major group of occupations called ‘Food processing, wood working, garment and other craft and related trades workers’, around 1.654 million workers (20% of ‘Craft and related trades workers’) engaged in the ‘Building and related trades workers, excluding electricians’ sub-major group, and another 1.516 million workers (19% of ‘Craft and related trades workers’) categorized under the sub-major group ‘Metal, machinery and related trades workers’;
- In the major group titled ‘Elementary occupations’, around 6.582 million people were engaged, which accounted for 21.6% of all informal sector workers in the country. These included 5.083 million people (77% of all those engaged in ‘Elementary occupations’) working in sub-major group ‘Labourers in mining, construction, manufacturing and transport’, 0.694 million workers (11% of all those engaged in ‘Elementary occupations’) identified under the sub-major group ‘Cleaners and helpers’, 0.452 million workers (7% of all those engaged in ‘Elementary occupations’) categorized in the sub-major group of ‘Refuse workers and other elementary workers’ and 0.327 million workers (5% of all workers in ‘Elementary occupations’) classified in the sub-major group of ‘Street and related sales and service workers’;
- In the ‘Plant and machine operators, and assemblers’ major group of occupations, 3.63 million people were engaged, accounting for 11.9% of all informal sector workers. These included 3.049 million workers (84% of all ‘Plant and machine operators, and assemblers’) categorized in the sub-major group of ‘Drivers and mobile plan operators’ and 0.562 million people (15% of the major group) working in the sub-major group of ‘Stationary plant and machine operators’;
- In the major group of occupations titled ‘Technicians and administration associate professionals’, around 1.184 million people were engaged, which accounted for 3.9 percent of all informal sector workers. These included 0.759 million workers (64% of all ‘Technicians and administration associate professionals’) in the sub-major group of ‘Business and administration associate professionals’;
- In the ‘Professionals’ major group of occupations, around 0.998 million people were engaged, accounting for 3.3% of all informal sector workers in the country. This major group included 0.472 million people (47% of all ‘professionals’) categorized in the sub-major group of occupations called ‘Teaching professionals’ and 0.384 million people (38% of all ‘professionals’) working in ‘Legal, social and cultural professional’ sub-major group of occupations;
- The ‘Managers’ major group of occupations comprised of 0.675 million people, accounting for 2.2% of all informal sector workers. These included 0.394 million (58% of all ‘managers’) in sub-major group of ‘Hospitality, retail and other services managers’;
- In the major group ‘Clerical support workers’, around 0.136 million people were engaged accounting for 0.4% of all informal sector workers, while in the ‘Skilled agriculture, forestry and fishery workers’ major group of occupations, only 0.039 million people (0.1% of all informal workers in the country) were engaged.
It is evident from the above analysis that more than 90% of all informal workers (27.5 million) in the country are engaged in only four major occupation groups viz. ‘Service and sales workers’, ‘Craft and related trades workers’, ‘Elementary occupations’ and ‘Plant and machine operators, and assemblers’. We will look in more details of these groups in our coming press releases.
Informal Sector Employed aged 10 years and above in Pakistan by Occupations Major Group & Sub-major Group (2020-21) (appendix)
This clustering of most informal sector workers around a few occupation groups provides an advantage in designing contributory hybrid social protection programmes by extending the ambit of existing institutions. This can bring in additional revenue for the existing institutions (e.g. EOBI, WWF, provincial ESSI’s and WWBs) which can be used to digitalize their systems as well as to expand their facilities all over the country. However, bringing the informal sector into the ambit of formality requires strong political commitment, a wide range of reform steps and sustained policies, which is a big challenge in the existing economic and political scenario in Pakistan.
Despite that, it is reiterated that in order to sustain economic growth and enhance productivity, there is an urgent need that the government takes initiative, in collaboration with the private sector organizations (e.g. Chambers of Commerce & Industry, Traders Associations etc.), to come up with viable and sustainable solutions for providing social protection facilities to all workers engaged in the informal sector so that they are able to sustain economic shocks and natural and manmade disasters.
Disclaimer: The views and inferences expressed in the article are that of the authors. This series is internally funded by PRIDE. No outside country or local funding has been received for this current activity.
APPENDIX
Informal Sector Employed aged 10 years and above in Pakistan by Occupations Major Group & Sub-major Group (2020-21)
| Sub-major Group | Numbers | Percentage |
| Managers | 675,630 | 100.00 |
| Administrative and commercial managers | 30,969 | 4.58 |
| Production and specialised services managers | 250,903 | 37.14 |
| Hospitality, retail and other services managers | 393,759 | 58.25 |
| Professionals | 997,535 | 100.00 |
| Science and engineering professionals | 14,876 | 1.49 |
| Health professionals | 88,466 | 8.87 |
| Teaching professional | 471,751 | 47.29 |
| Business and administration professionals | 19,029 | 1.91 |
| Information and communications technology | 19,837 | 1.99 |
| Legal, social and cultural professionals | 383,577 | 38.45 |
| Technicians and associate professionals | 1,184,347 | 100.00 |
| Science and engineering associate professionals | 39,258 | 3.31 |
| Health associate professionals | 158,655 | 13.40 |
| Business and administration associate professionals | 759,263 | 64.11 |
| Legal, social, cultural and related associate professionals | 202,595 | 17.11 |
| Information and communications technicians | 24,576 | 2.08 |
| Clerical support workers | 135992.7 | 100.00 |
| General and keyboard clerks | 29,005 | 21.33 |
| Customer services clerks | 74,099 | 54.49 |
| Numerical and material recording clerks | 28,182 | 20.72 |
| Other clerical support workers | 4,707 | 3.46 |
| Service and sales workers | 9154879.5 | 100.00 |
| Personal service work | 1,325,936 | 14.48 |
| Sales workers | 7,714,309 | 84.26 |
| Personal care workers | 28,118 | 0.31 |
| Protective services workers | 86,517 | 0.95 |
| Skilled agricultural, forestry and fishery workers | ||
| Market-oriented skilled agricultural workers | 39,732 | 100.00 |
| Craft and related trades workers | 8,089,013.90 | 100.00 |
| Building and related trades workers, excluding electricians | 1,654,009.70 | 20.45 |
| Metal, machinery and related trades workers | 1,516,503.70 | 18.75 |
| Handicraft and printing workers | 494,260.60 | 6.11 |
| Electrical and electronic trades workers | 674,889.00 | 8.34 |
| Food processing, wood working, garment and other craft and related trades workers | 3,749,350.90 | 46.35 |
| Plant and machine operators, and assemblers | 3,629,872 | 100.00 |
| Stationary plant and machine operators | 561,624 | 15.47 |
| Assemblers | 19,112 | 0.53 |
| Drivers and mobile plant operators | 3,049,135 | 84.0 |
| Elementary occupations | 6,582,284 | 100.00 |
| Cleaners and helpers | 693,976 | 10.54 |
| Agricultural, forestry and fishery labourers | 2,348 | 0.04 |
| Labourers in mining, construction, manufacturing and transport | 5,082,710 | 77.22 |
| Food preparation assistants | 24,332 | 0.37 |
| Street and related sales and service workers | 326,915 | 4.97 |
| Refuse workers and other elementary workers | 452,002 | 6.87 |
| Grand Total | 30,489,286 |
Source: Author’s Calculation form micro data of Pakistan Bureau of Statistics (PBS), Labour Force Survey, 2020-21