𝐄𝐬𝐭𝐢𝐦𝐚𝐭𝐢𝐨𝐧𝐬 𝐛𝐲: Asia Faisal, Pride Pakistan
PRIDE Consulting estimated the series of youth (ages 15-29) using microdata from various issues of the Labour Force Survey. The Pakistan Bureau of Statistics (PBS) conducted 14 rounds of the Labour Force Survey (LFS) between 2001-02 and 2020-21. Values for six missing years, during which the LFS was not conducted, have been interpolated (indicated as underlined) to create a consistent time series.
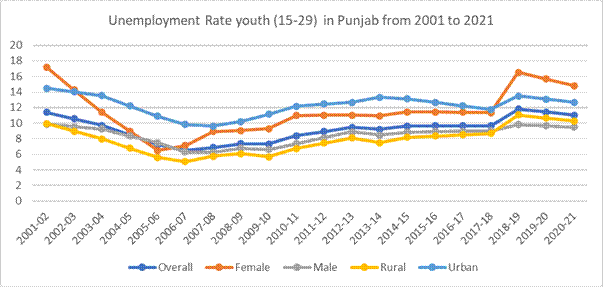
Table 1: Unemployment Rate of Youth (15-29), Punjab (2001-02 to 2020-21)
| Years | Overall | Female | Male | Rural | Urban |
| 2001-02 | 11.38 | 17.19 | 9.85 | 9.93 | 14.49 |
| 2002-03 | 10.55 | 14.29 | 9.55 | 8.96 | 14.01 |
| 2003-04 | 9.71 | 11.38 | 9.24 | 7.98 | 13.52 |
| 2004-05 | 8.47 | 8.95 | 8.36 | 6.79 | 12.20 |
| 2005-06 | 7.23 | 6.51 | 7.47 | 5.59 | 10.88 |
| 2006-07 | 6.51 | 7.11 | 6.3 | 5.06 | 9.82 |
| 2007-08 | 6.88 | 8.92 | 6.24 | 5.73 | 9.62 |
| 2008-09 | 7.35 | 9.03 | 6.78 | 6.06 | 10.21 |
| 2009-10 | 7.33 | 9.3 | 6.62 | 5.67 | 11.13 |
| 2010-11 | 8.38 | 10.99 | 7.37 | 6.74 | 12.19 |
| 2011-12 | 8.92 | 11.01 | 8.12 | 7.42 | 12.44 |
| 2012-13 | 9.46 | 11.02 | 8.86 | 8.09 | 12.68 |
| 2013-14 | 9.22 | 10.94 | 8.46 | 7.47 | 13.31 |
| 2014-15 | 9.63 | 11.44 | 8.85 | 8.19 | 13.13 |
| 2015-16 | 9.65 | 11.41 | 8.9 | 8.35 | 12.67 |
| 2016-17 | 9.67 | 11.38 | 9.09 | 8.51 | 12.21 |
| 2017-18 | 9.68 | 11.36 | 8.99 | 8.66 | 11.75 |
| 2018-19 | 11.82 | 16.55 | 9.82 | 11.04 | 13.49 |
| 2019-20 | 11.42 | 15.67 | 9.65 | 10.66 | 13.09 |
| 2020-21 | 11.02 | 14.79 | 9.48 | 10.27 | 12.68 |
| Difference/range* | -0.36 | -2.4 | -0.37 | 0.34 | -1.81 |
Source: Pakistan Bureau of Statistics (PBS), Labour Force Survey, various issues
*Difference/range between latest to oldest year (2020-21 to 2001-02)
PBS conducted 14 rounds of LFS during 2001-02 to 2020-21. Values of six missing years when LFS was not conducted have been interpolated (underlined) to make consistent time series.